

What the memory controller actually does
The cgroup v2 memory controller enforces a per-cgroup memory budget that the page allocator checks at every allocation. When a cgroup exceeds its allowance, the kernel starts reclaiming its pages, slowing down its tasks under memory pressure, and — if the cgroup is at its hard limit and cannot recover — killing one of its tasks to free pages.
It is not just accounting. The page allocator can charge a page against a cgroup’s counter, and if the charge would push the cgroup over memory.max, the allocation fails back to the slowpath → reclaims from the cgroup’s own LRU → if nothing’s reclaimable, returns -ENOMEM and the requesting task traps to the OOM-kill path.
The implementation lives in mm/memcontrol.c and uses struct mem_cgroup as the per-cgroup state (one per-memory-cgroup, attached to a CSS = cgroup_subsys_state). The counter is memory_usage_in_bytes (the lower-level name; memory.current is the user-visible file), backed by a per-node memcg_vmstats-style array for NUMA awareness.
Three limits, not one
The most-misunderstood property of cgroup v2 memory accounting is that there are three tuneable limits, not one:
| File | Meaning | When it fires |
|---|---|---|
memory.low |
Soft protection — never reclaim from this cgroup unless the parent can’t make progress | When global reclaim sees pressure but this cgroup is below low, reclaim skips it |
memory.high |
Soft cap — try to reclaim down to here when the cgroup exceeds it | Whenever memory.current > high; sleeps in allocator slowpath if reclaim stalls |
memory.max |
Hard cap — at this point, OOM-kill is invoked | Allocation that would push current >= max fails forward to the OOM killer |
Read this top-down: low is what you protect (keep cheap from eviction), high is what you target (reclaim down to), max is what you enforce (kill if hit). Set high at, say, 80% of max and let the kernel throttle the workload before you cross into OOM territory.
The most common configuration mistake is setting memory.max to the same value as you actually want and not setting memory.high separately — leaving the workload to OOM-kill at the worst possible moment rather than throttle gracefully.
The LRU side — every cgroup has its own
When a cgroup owns a page, the page is accounted on the cgroup’s LRU list (memcg_lruvec structures under mem_cgroup_per_node). The kernel never reclaims a page from a sibling cgroup to satisfy another cgroup’s memory deficit. This is what makes per-cgroup isolation actually work.
LRU accounting starts at page charge time (mem_cgroup_charge()). When a cgroup’s pages are touched, they move into its own active/inactive LRU on the appropriate node. Reclaim walks that cgroup’s LRU only. Two consequences:
- A misbehaving cgroup cannot exhaust reclaim bandwidth for its siblings. Cgroup A hitting
memory.maxonly thrashes its own LRU, not Cgroup B’s. This is the “isolation” property the OOM-kill history in legacy cgroup v1 was notoriously missing. - Reclaim work correlates with that cgroup’s working set. If Cgroup A’s pages are all cold inactive, a single direct-reclaim pass drains them quickly. If they’re all active, reclaim is slow and stalls tasks on the slowpath.
LRU list structures
Inside mm/memcontrol.c:
struct mem_cgroup_per_node {
    struct mem_cgroup *memcg;
    struct lruvec       lruvec;            // embed LRU state here
    unsigned long       lru_size[NR_LRU_LISTS];
    struct deferred_split shrink_deferred;
    // ...
};
The kernel’s reclaim code (shrink_node(), shrink_lruvec() in mm/vmscan.c) takes a struct lruvec * pointer, which is sourced from the cgroup’s per-node structure. That’s the connection. Without going through the per-cgroup memcg_lruvec, the global reclaim path doesn’t touch your cgroup.
The hot path — what happens on every fault
Every time the kernel services a page fault — anonymous or file — it walks the cgroup chain to charge the page:
// mm/memory.c handle_pte_fault -> do_anonymous_page -> ...
// Behind the scenes:
struct mem_cgroup *memcg = get_mem_cgroup_from_mm(current->mm);
int err = mem_cgroup_charge(memcg, page, mm, GFP_KERNEL);
//                ^-- this is what fails the allocation if memory.max is hit
The mem_cgroup_charge() call returns success only if there’s budget available. On failure, the caller hits try_charge_memcg(), which on failure:
- Triggers direct reclaim for the current cgroup:
try_to_free_pages()walks the cgroup’s LRU. - If that succeeds, retry the charge.
- If reclaim doesn’t yield enough, the path returns
ENOMEMor invokes the cgroup’s OOM killer.
The OOM-kill path is:
// mm/oom_kill.c
mem_cgroup_out_of_memory(memcg, ...);
//    -> select_bad_process() to pick a victim
//    -> oom_kill_process(cgrp, victim, ...)
//    -> signal SIGKILL
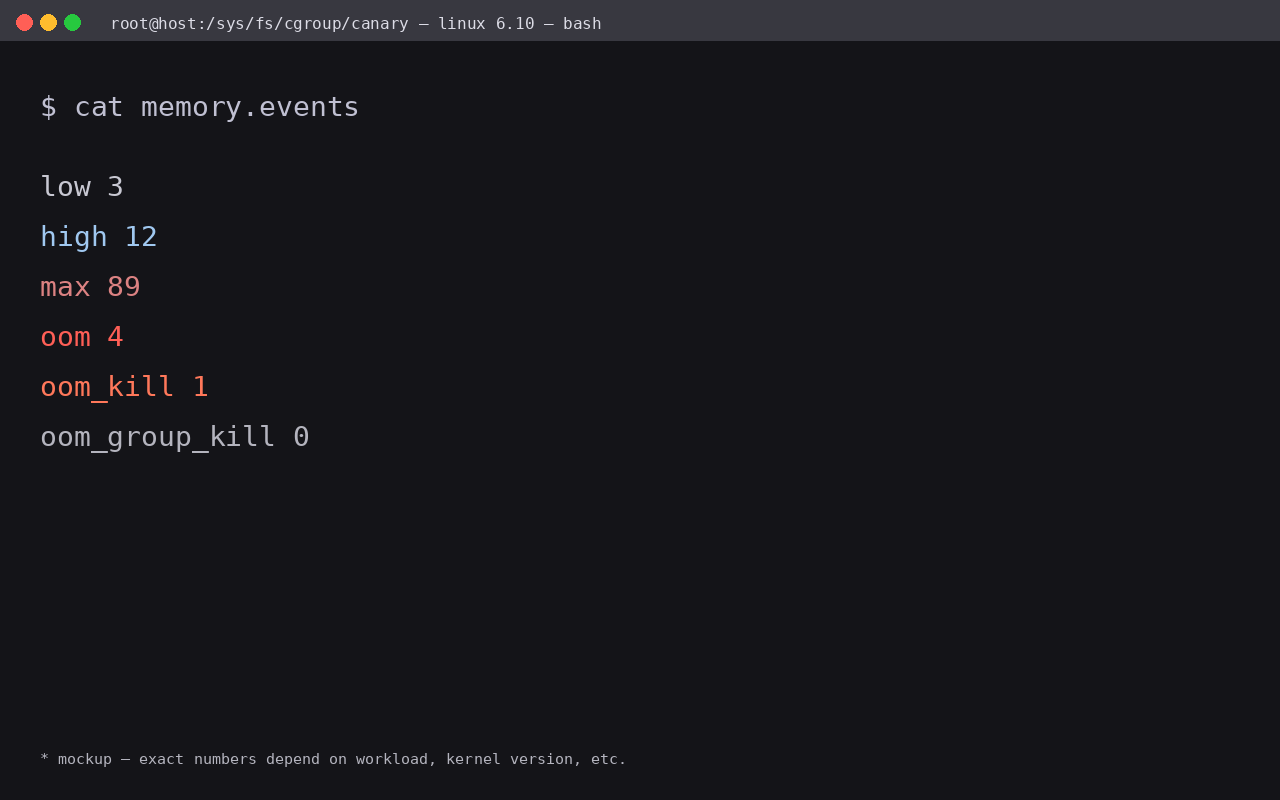
You can read the OOM-kill history from memory.events:
cat /sys/fs/cgroup/canary/memory.events
# low 3
# high 12
# max 89
# oom 4
# oom_kill 1
A nonzero oom counter means at least one task was killed. oom_kill and oom together convey “OOM-kill was triggered” and “this cgroup lost at least one process.”
memory.pressure and the PSI backend
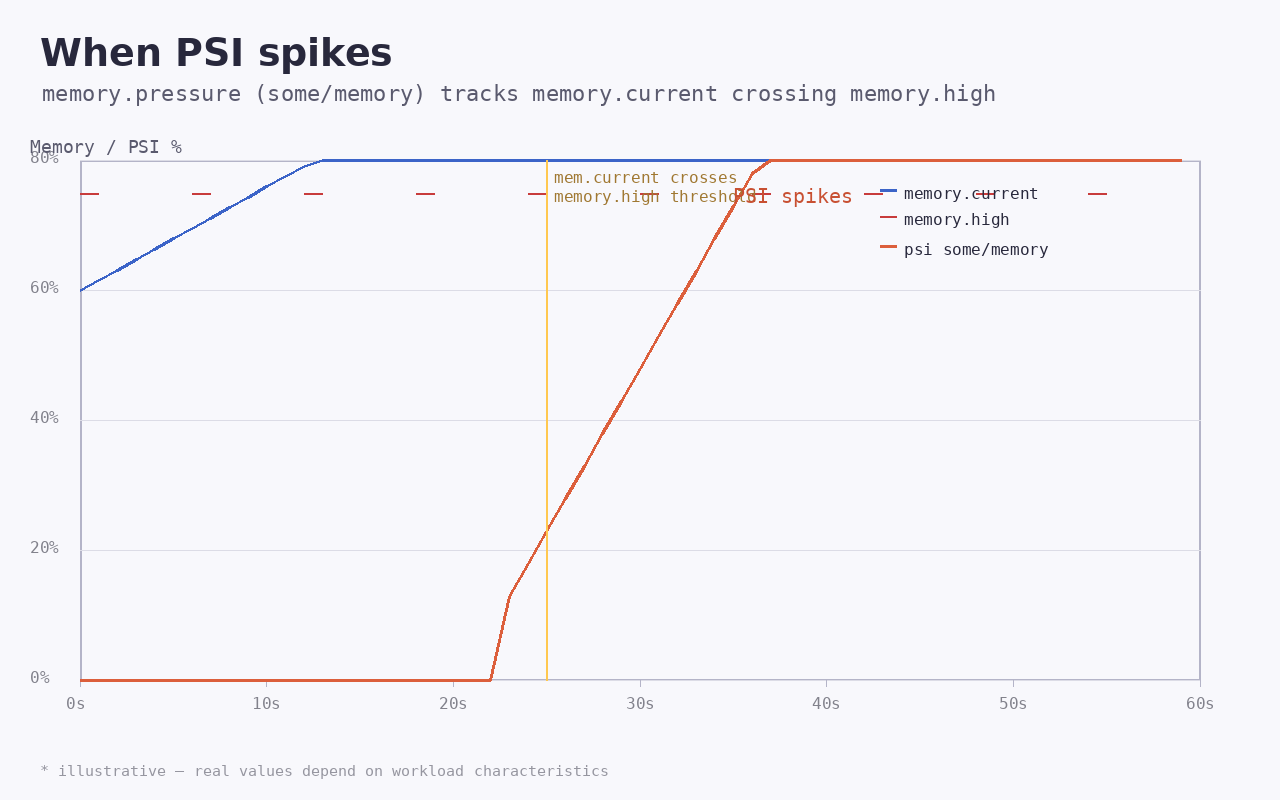
The PSI accounting we covered in Linux PSI memory pressure: what it really measures sits directly on the cgroup’s reclaim pressure. Every time a task in this cgroup stalls on the page fault path waiting for memory, psi_memstall_enter is called, and the cgroup’s some/memory line gets stamped.
Practically: if memory.pressure shows some avg10 > 5.0, your cgroup is at or above its memory.high budget and reclaim is running into trouble. That might mean:
- workload’s working set exceeds the cgroup budget (resize the cgroup)
- per-node pressure is imbalanced (NUMA-aware tuning needed)
- a leak is consuming budget (check
memory.currenthistory)
Use memory.pressure together with memory.current, memory.high, memory.events — these four files give a complete picture of “what’s happening right now and what happened recently.”
Reading and writing the cgroup memory state
CG=/sys/fs/cgroup/lab
# Actual current usage
echo "current: $(cat $CG/memory.current)"
# Set a soft limit (reclaim target)
echo 536870912 > $CG/memory.high        # 512 MiB
# Set a hard limit (kill target)
echo 1073741824 > $CG/memory.max       # 1 GiB
# Cache / buffer pooling knob (default 0)
echo 0 > $CG/memory.swap.max           # don't swap; we have no swap on the host
# Read the OOM history
cat $CG/memory.events
Putting the workload in $CG is just:
ls /proc/$$/cgroup                  # find the controller slice path
echo $$ > $CG/cgroup.procs            # move this process into the cgroup
# cgroup.procs accepts a single PID per write; use a loop for several
while read p; do echo $p > $CG/cgroup.procs; done < pids-to-move.txt
If you want the entire Kubernetes pod, target the cgroup the kubelet created (typically kubepods/.../podid/). Setting memory.max on the pod level is enforced for every container within. Setting it on a single container isolates that container from its pod neighbours.
What memory.events means in detail
| Counter | Meaning |
|---|---|
low |
Number of times the cgroup’s page reclaim was skipped because the cgroup is under memory.low (i.e. another cgroup reclaimed first) |
high |
Number of times the cgroup hit memory.high and was forced into reclaim |
max |
Number of times the cgroup hit memory.max |
oom |
Number of times the cgroup’s OOM-killer was invoked |
oom_kill |
Number of times a task was actually killed |
oom_group_kill |
If memory.oom.group=1, killed the entire cgroup at once |
A common production pattern:
# warn when sum(high) per minute > 60 (i.e. average > 1Hz reclaim)
watch -n 60 'awk "{print \$1\" \"\$2}" /sys/fs/cgroup/canary/memory.events | grep high'
If high climbs while current plateaus, your cgroup is thrashing — reclaim is running constantly but not making headway. That’s a resize or workload-tune signal, not a normal operation.
Swap and zswap under cgroup v2
memory.swap.max controls swap-out at the cgroup level. Setting it to 0 doesn’t mean “no swap” globally — it means “this cgroup cannot swap”, and the kernel will fail any swap-out path with memory.swap.events accumulating fail counters.
The big change from v1: v2 makes swap accounting mandatory and hierarchical. If you have memory.swap.max=0 at the parent, no child can swap even if the child sets a positive value. There’s no per-child override that bypasses a parent’s zero setting.
For zswap specifically: zswap is enabled at kernel level (CONFIG_ZSWAP=y). cgroup v2 doesn’t gate it per-cgroup, but the size limit /sys/module/zswap/parameters/max_pool_percent is global. If you’re tuning cgroup memory limits aggressively, you also need to consider zswap’s global pool size, otherwise a memory-hungry workload can fill the pool and fall back to disk.
The ancestor inheritance model
The most useful property of cgroup v2 over v1: the controller is hierarchical, single-mode. There’s no per-controller v1 hierarchy to debug against. Whatever limits you set on the root of a subtree flow down, and they cumulate.
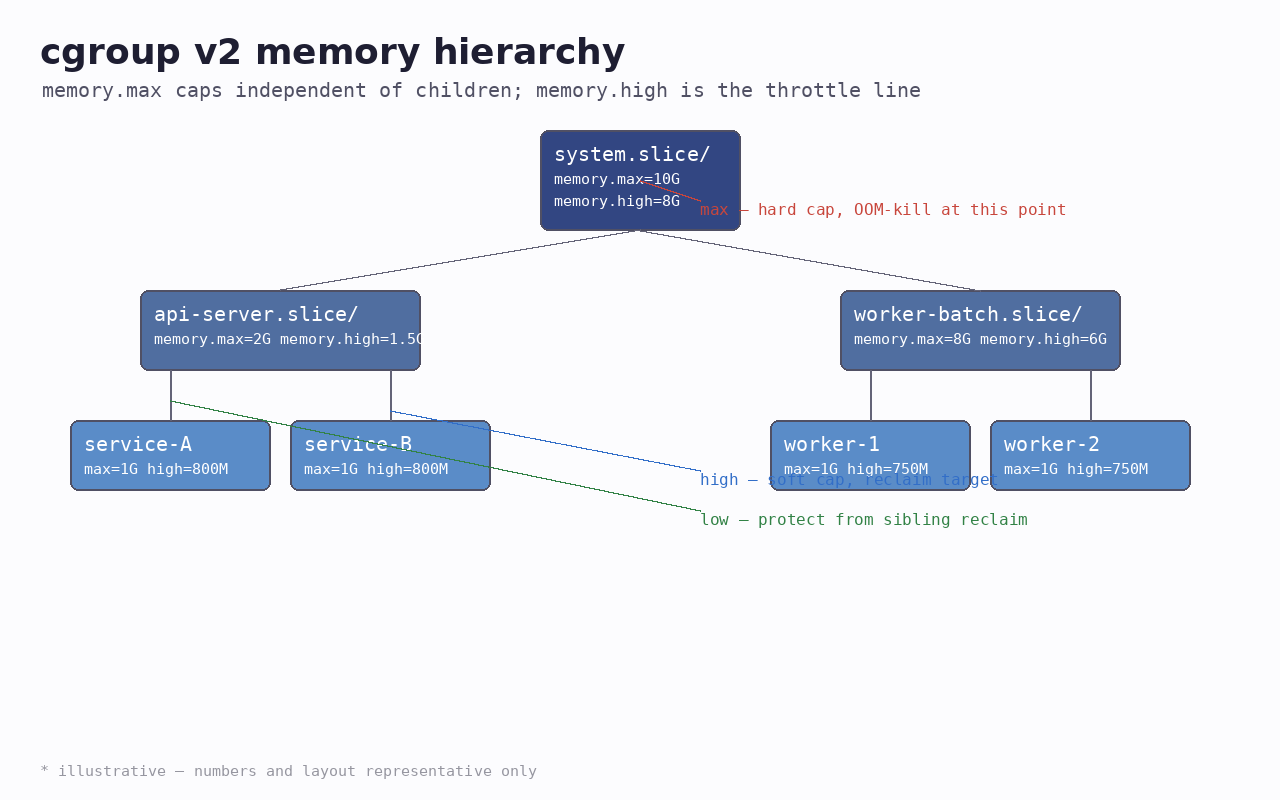
A clean layout for a web service backend:
system.slice/
├── api-server.slice/                # memory.max=2G, memory.high=1.5G
│   ├── service-A.slice/             # memory.max=1G, memory.high=800M
│   └── service-B.slice/             # memory.max=1G, memory.high=800M
└── worker-batch.slice/              # memory.max=8G, memory.high=6G
    └── worker-N/                    # memory.max=1G per worker, but capped by parent
Set memory.max on the leaf, set memory.high ~80% of that, and set memory.max on the parent as a backstop that prevents the slice from exceeding its cluster budget. Memory accounting is per-cgroup and hierarchical, which means the parent’s max is independently enforced against the sum of children, not equally.
Composing with PSI — the headroom dashboard
A practical observability recipe is to pair memory.pressure with memory.current/memory.high/memory.max:
| Symptom | Likely cause |
|---|---|
memory.pressure some avg10 > 5 AND current > high AND memory.events.high is climbing |
Workload working set > high budget. Resize high, or workload-tune. |
Same as above but current < high |
Reclaim is racing on a sibling cgroup, or NUMA-imbalance. Check sibling memory.current. |
pressure flat but memory.events.low is climbing |
A different (sibling) cgroup is reclaiming because the local one is protected by memory.low. You over-protected this cgroup. |
memory.events.oom nonzero |
Below high but at max; downstream is bursty. Resize high or fix the burst. |
memory.events.max nonzero without oom |
A charge attempt failed forward without OOM — happened during reclaiming, kernel retried successfully. Common during cold cache. |
This four-file readout tells you everything you need for a memory-related incident without :latest /proc/meminfo digging.
Page-cache accounting — the non-obvious edge
cgroup v2 does count page cache against your cgroup’s budget, and it accounts the cache as the first-touching cgroup. If your service opens a 4GB CSV file in cgroup A, that 4GB is in A’s memory.current. If A then forks and the child in cgroup B reads from the page-cache page that’s already mapped, B doesn’t double-count — but if B dirties the page (writes), the dirty is attributed to B.
This is “memory ownership at the page level” and it directly determines who’s responsible for the reclaim cost when the cache is under pressure. Verify it like this:
# After loading a large file, check that the reading cgroup's current went up
cat /sys/fs/cgroup/api-server.slice/memory.current       # before
# ...
cat /sys/fs/cgroup/api-server.slice/memory.current       # after — should reflect file size
If the page cache was hot in another cgroup before your reading cgroup touched it, the kernel does best-effort attribution by the cgroup that’s been reading on the page most recently. Don’t rely on it being perfect — it’s a heuristic for hot caches, not a billing system.
Huge pages
hugetlb. controllers are a separate cgroup controller. To use hugepages under cgroup v2, the kernel needs CONFIG_MEMCG_HUGETLB=y and the parent has to opt into the controller via cgroup.subtree_control +hugetlb. You will see:
hugetlb.<pagesize>.currenthugetlb.<pagesize>.maxhugetlb.<pagesize>.events
Same accounting model, separate counters. A common bug is expecting memory.current to include hugepages — it doesn’t. Big workloads that pin large arenas (JVM, ClickHouse) often get tagged wrong because of this.
Looking at the kernel code
The essential files:
mm/memcontrol.c— the bulk of the implementationmm/vmscan.c— reclaim walks the memcg’s LRUmm/page_alloc.c— slowpath with__GFP_ACCOUNTflagmm/oom_kill.c— OOM-kill selection logickernel/cgroup/cgroup.c— the controller-registration machineryDocumentation/admin-guide/cgroup-v2.rst— the canonical user doc
The first thing to grep in this code if you’re debugging: search do_try_to_free_pages (reclaim entry), mem_cgroup_charge (charge path), mem_cgroup_out_of_memory (OOM path).
Production pitfalls
- Setting
memory.maxonly withoutmemory.high. The workload OOM-kills at the worst possible moment instead of throttling. Always set high, which is the soft throttle, and max as the backstop. - Forgetting the parent cap. A child with high
memory.max = 4Gunder a parent withmemory.max = 2Gwill get OOM-killed at 2G of total children usage. Don’t set it assuming children can’t exceed. - Enabling memory.swap at the wrong layer. If the swap subsystem isn’t on for the cgroup (
+swapinsubtree_control),memory.swap.*files are absent. - Conflating page cache and RSS in dashboards. They’re both in
memory.current, but only RSS matters for+50Mworkload sizing. Usememory.statto inspect. - Trusting memory.events.oom alone. Check
oom_killtoo —oom=4 oom_kill=1means 4 OOM invocations but 1 successful kill (rest rescued by reclaim or signal handling). - Forgetting that the OOM killer respects
oom_score_adj. Lower score = survive longer. If a sidecar has a very lowoom_score_adj, the OOM-killer will repeatedly kill your main service first. Set OOM scores deliberately. - Not enabling
memory.peakfor historical tracking. Linux 5.9+ supports per-cgroupmemory.peak— the high-water mark since boot. Use it for capacity planning. - Using cgroup v1 hierarchies by accident. A systemd-managed host with
systemd.unified_cgroup_hierarchy=0boots v1. Usecat /proc/cmdline | grep cgroup_no_v1=to verify v2 is enabled. Or, simpler, check thatcgroup.subtree_controlexists (v2 only).
How it composes with PSI
To close the loop: PSI tells you “your cgroup is stalling”, memory.events + memory.current tell you “your budget is being enforced”, memory.high setting tells the kernel when to start soft-throttling. The combination of these gives a closed control loop:
        ┌──────────────────┐
        │  workload tasks   │
        └────────┬──────────┘
                 │ page fault
                 ▼
        ┌──────────────────┐         ┌────────────────┐
        │ mem_cgroup_charge │────────▶│ PSI memstall_enter│──▶ memory.pressure
        └────────┬──────────┘         └────────────────┘
                 │ over limit
                 ▼
        ┌──────────────────┐
        │ reclaim walk LRU  │──▶ memory.events.high++
        └────────┬──────────┘
                 │ no progress
                 ▼
        ┌──────────────────┐
        │  OOM-kill task    │──▶ memory.events.oom++
        └──────────────────┘
The full picture ties PSI (real-time signal) to memory.events (counted-occurrences) to memory.current (instant usage) — three different angles on the same memory budget.
When to use memory.high vs memory.max
If you have a workload that’s bursty (allocation spikes), memory.high is what you want — the kernel will throttle-and-reclaim smoothly across the spike instead of hitting OOM. Use memory.max only when you want the workload’s instance count to be hard-cutoff (e.g. noisy neighbour prevention in a multi-tenant cluster). Set both if you want layered protection: max as the backstop, high as the warning line.
## Related articles
This is one of three on Linux kernel memory management under tux.fan’s os-kernel tag.
– [Linux PSI memory pressure: what it really measures](https://tux.fan/2026/07/21/psi-memory-pressure/) — companion piece. The PSI on `memory.pressure` is the runtime signal of cgroup reclaim pressure; this article is the budget model those signals report against.
– [Linux multi-generational LRU: state of mglru in 2026](https://tux.fan/2026/07/21/mglru-page-reclaim/) — the reclaim algorithm that walks each memcg’s LRU. The article covers the generational algorithm, the active/inactive comparison, and the live 2026 LSFMM+BPF discussion on whether the algorithm survives.
Comments