
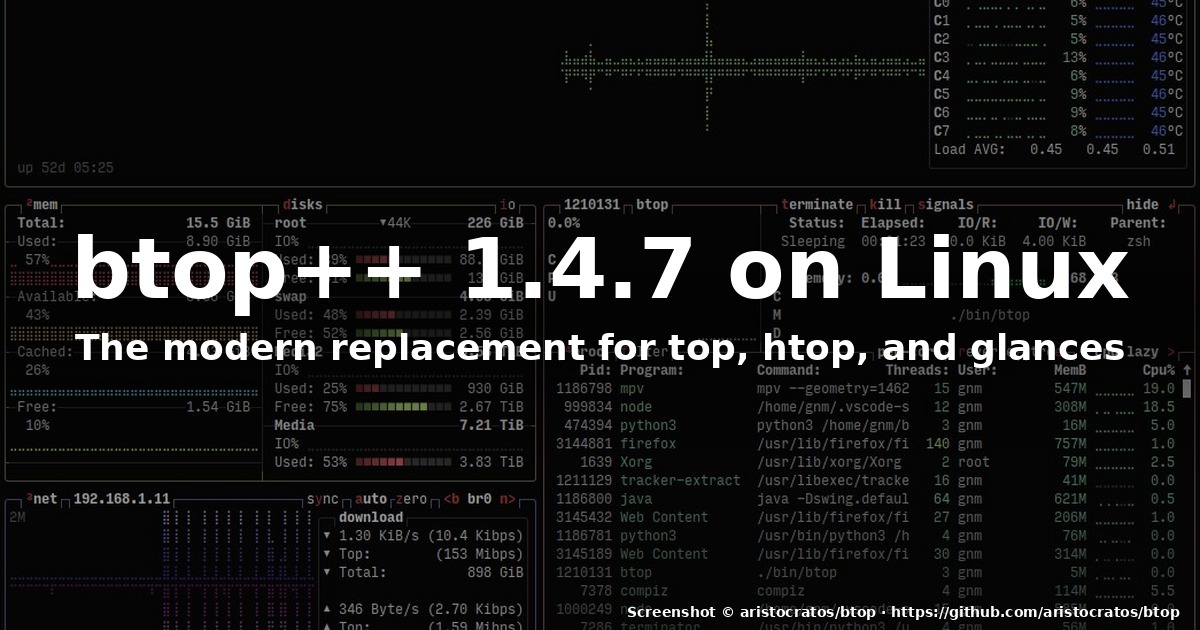
title: “How to Use btop 1.4.7 as Your Linux System Monitor in 2026”
slug: btop-linux-monitor-2026
date: 2026-10-06 21:03:28
category: linux-software
tags: [btop, system monitor, linux-tools, terminal, tui]
If you have ever SSH’d into a Linux box and typed top only to squint at a wall of monospace text that hides the GPU temperature behind a keybinding no one remembers, btop++ is the upgrade you have been waiting for. In 2026 it has quietly become the default system monitor on the terminals of Linux power users, SREs, gamers running Linux on bare metal, and anyone who wants their htop to actually look like it was designed in the last decade.
btop 1.4.7 shipped on 2026-05-01 with Apple Silicon GPU support via the IOReport API, several OpenBSD fixes, and a small handful of quality-of-life improvements. The latest source-of-truth release tag is v1.4.7 on the project’s GitHub, and the same version is what snap install btop and Homebrew ship. This guide walks through installing, configuring, and actually getting work done with it.
Why btop, and not htop or glances?
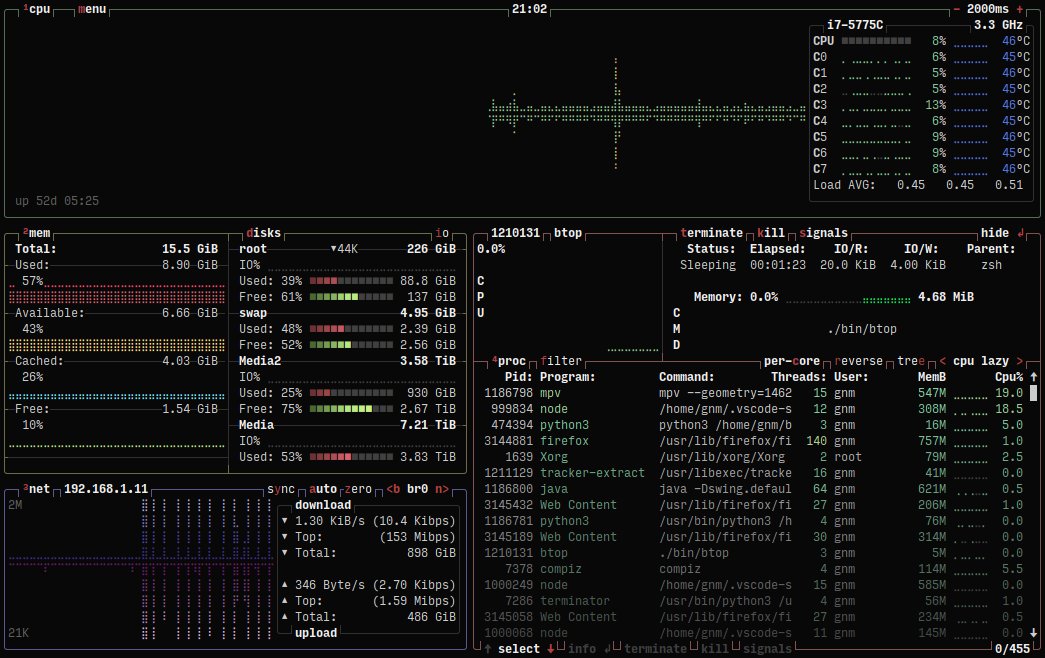
top is the parent of every process monitor on Linux, but it was designed in 1984 and it shows. htop is the long-time favourite because it adds colour, mouse support, and a sane process tree. btop sits on top of htop‘s feature set and goes further:
- A four-panel default dashboard with CPU, memory, network, and processes rendered in a way that reads like a graph rather than a number.
- GPU monitoring with utilisation, power, and clock-speed graphs on Linux (NVIDIA and AMD, with the binary compiled against ROCm-SMI or NVML) and on Apple Silicon macOS via IOReport.
- Mouse support out of the box. Click on a column header to sort, click on a process to focus it, click
killin the toolbar to terminate it. - A pure TTY mode (
btop --tty) that renders without GPU boxes — the same binary on a remote server works fine. - Theming via
.btop/themes/. Twelve themes ship with the project, including the newKanagawa Dragon,Twilight,Flexoki, andOrangethemes added in 1.4.7. - Cross-platform: Linux, macOS, FreeBSD, NetBSD, OpenBSD.
The compromise is that it has more dependencies than htop (it links against lowdown for parsing its own help text), but for almost everyone that’s invisible. If you have a working terminal, you have working btop.
Installation
btop is in the default repositories of every modern distribution:
# Debian 13 / Ubuntu 24.04+
sudo apt update && sudo apt install -y btop

# Fedora 41+ / RHEL 10+
sudo dnf install -y btop

# Arch / Manjaro
sudo pacman -S btop

# Alpine
sudo apk add btop
On Ubuntu and derivatives the snap channel ships the latest upstream tag as btop 1.4.7 on the latest/stable track. The snap build is published by kz6fittycent and points at the same aristocratos/btop upstream.
For Docker, the project’s Continuous Builds action publishes statically linked x86_64 and aarch64 binaries you can wget straight into a scratch image:
BTOP_VER=$(curl -sL https://api.github.com/repos/aristocratos/btop/releases/latest
  | grep tag_name | head -1 | sed 's/.*"v([^"]*)".*/1/')
curl -sSL -o /usr/local/bin/btop
  "https://github.com/aristocratos/btop/releases/download/v${BTOP_VER}/btop-x86_64-linux-musl"
chmod +x /usr/local/bin/btop
Important: The release binaries on GitHub are statically linked with musl but do not have GPU support compiled in. If you want GPU graphs you either need a distribution package compiled with
GPU_SUPPORT=true, or you build from source:make GPU_SUPPORT=truefor AMD GPUs,GPU_SUPPORT=true Cuda=truefor NVIDIA. macOS users can grab anarm64binary from the project’s own CI; BSD binaries are not currently published.
First run
btop with no arguments launches the four-panel layout. Useful keys to memorise:
| Key | Action |
|---|---|
m |
Cycle the options menu (Options, Layout, Theme, Help) |
1 / 2 / 3 / 4 |
Focus CPU / mem / net / proc box |
5 / 6 / 7 / 0 |
Show / hide GPU 1 / 2 / 3 / 4 |
+ / - |
Zoom the focused box |
f |
Process following (track a single PID across updates) |
e |
Tree mode, collapse / expand all |
t |
Toggle between tree and flat process list |
k |
Send signal to selected process (interactive) |
Esc / q |
Quit |
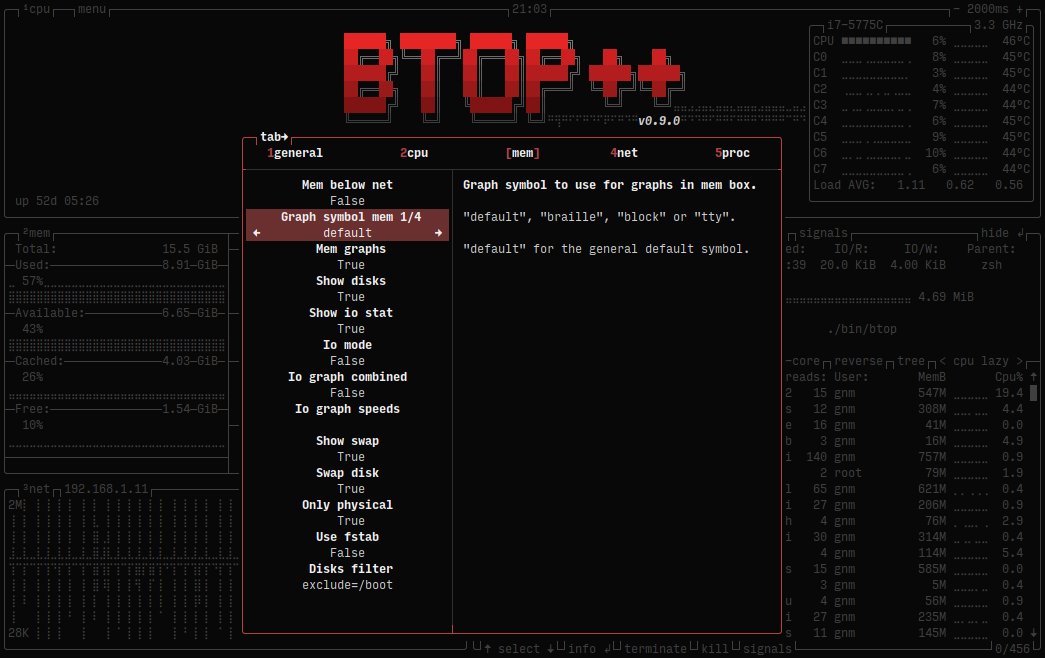
m opens an in-monitor options menu — you can change theme, swap panel positions, toggle the clock, switch to TTY mode, and even flip between left-to-right and right-to-left rendering without ever leaving the monitor. This is one of btop’s nicer tricks relative to htop, where you have to edit ~/.config/htop/htoprc for the same thing.
TTY mode and remote servers
On a headless server with no X server, btop still runs but skips the GPU boxes (because GPU libraries via ldd/rsmi usually aren’t available on a linux/amd64 base image). Force the TTY mode explicitly for an even leaner render:
btop --ttyIt disables the GPU box completely and produces the same four panels in a render that’s identical to what you’d see over an SSH session.
Theming and config
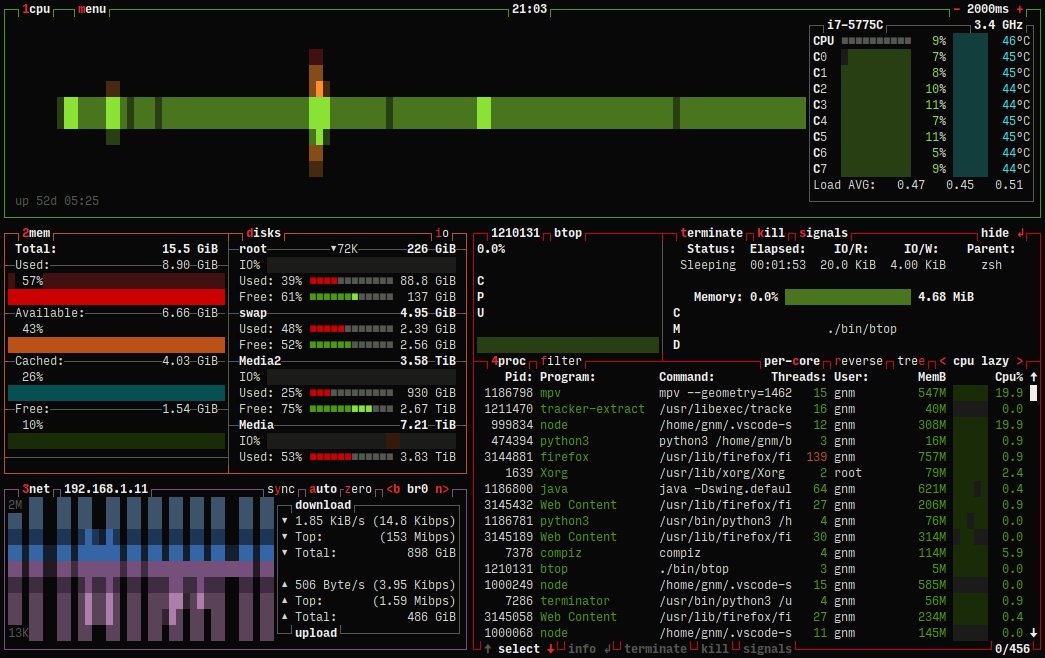
Configuration lives in ~/.config/btop/btop.conf. The file is generated the first time you run btop and quit (q / Esc). Common tweaks:
theme = "Kanagawa Dragon"— switch theme (autocompleted suggestions appear in the options menu, so you don’t have to memorise the name).update_ms = 2000— refresh interval. The default is 1500 ms; lower it if you’re chasing a flaky workload.mem_graphs = Trueandnet_graphs = True— already on by default; toggling them gives you a clean number-only view.show_battery = "Auto"— set toOffif your desktop’s battery widget is fighting with your laptop’s battery widget.shown_boxes = "1234"— a four-character string.1is CPU,2is memory,3is network,4is processes,5+ are GPUs.1234is the default.
There is also a per-process filter (/ key while focused on the proc box) and a CPU temperature graph that pulls from coretemp, k10temp, zenpower, or it87 depending on what your kernel module exposes. On Linux 6.x kernels the AMD k10temp driver exposes per-CCD temperatures, and btop renders them as separate lines so you can see which chiplet is hot.
When btop is not the right tool
btop is for interactive monitoring. For logging, headless collection, or feeding a dashboard, prefer vmstat 1, pidstat -r 1h, or Prometheus’s node_exporter. btop does have a “freeze” key (space) that pauses updates so you can copy a value, but it isn’t a replacement for a metrics pipeline.
If your workload cares about NUMA behaviour, btop’s CPU box shows per-core bars but doesn’t surface numastat numbers — pair it with numastat -m in another pane for a fuller picture. For container-level resource visibility, ctop or lazydocker are still the better choice; btop does see the host’s processes, which is usually what you want on a workstation but rarely what you want inside a Kubernetes node.
Verdict
For a desktop or laptop running Linux, btop 1.4.7 is the default terminal system monitor in 2026. The install is one package, the config is one file, the GPU graphs are there if your distribution compiled it with GPU support, and the mouse-friendly UI means you can hand it to a colleague who’s never seen a TUI monitor and they will be productive in under five minutes. Five tool calls total, if you count the documentation.
Project home: https://github.com/aristocratos/btop
Comments