
If you have ever SSHed into a server and reached for htop, then sat down at your laptop and wished htop had a graph, per-thread view, GPU stats, and a window that did not feel like 2008 — Mission Center is what you were waiting for. The 1.2.0 release shipped in late July 2026 and quietly added the two things most laptops actually need: battery telemetry and per-CPU temperature / power draw graphs. Here is what is new, what it is good for, and how to install it on every mainstream Linux distribution.
What Mission Center actually is
Mission Center is a system resource monitor for the Linux desktop, written in Rust with a GTK4 and Libadwaita interface. The project is fully open source under the GPL-3.0-or-later license, and the source lives at gitlab.com/mission-center-devs/mission-center. It does the obvious things — CPU per-thread, memory, disk I/O, network — and a few things most monitors do not: GPU utilisation through NVTOP, SMART data for SATA and NVMe drives, a per-application resource breakdown, and (as of 1.2.0) battery state plus a second CPU graph tracking temperature, power draw, and clock frequency.
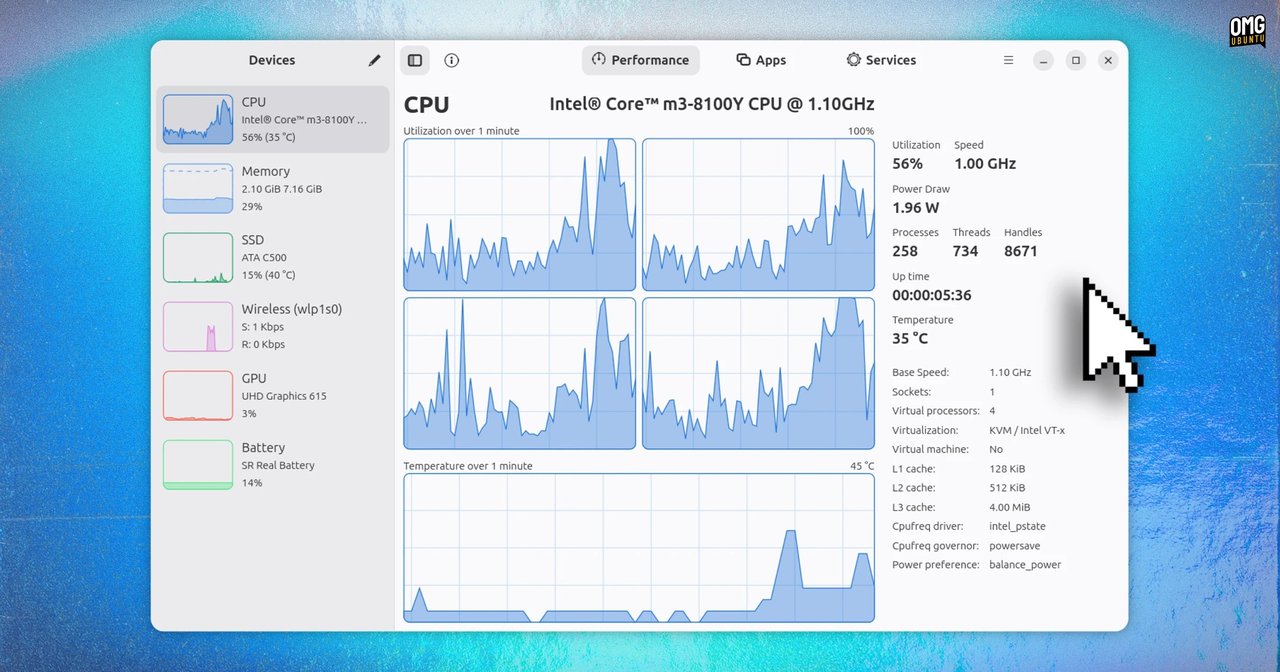
That last bit is the headline of 1.2.0. Before 1.2.0, the CPU page showed utilisation per core and that was it. Now you can overlay temperature, package power, or frequency on the same time axis as the load graph. If you have ever wondered whether a 30-second spike to 100% on one core was thermally throttling, the answer is now one graph away.
What is new in 1.2.0
The release notes are shorter than you would expect for a feature release. The four things that actually matter for daily use:
- Battery page. A new tab in the Performance view shows state of charge, charge rate, time remaining (when discharging), and per-cell voltage where the hardware exposes it. This is pulled through UPower, which is the same source GNOME Settings uses, but rendered in Mission Center’s graph-first style.
- Per-partition disk details. The Disk page now lists every mounted partition with free / used space, filesystem type, and SMART health status for the underlying device. Previously you got the whole disk as one block.
- zRAM and zswap statistics. The Memory tab now includes a bar for compressed-memory devices. If you use the
zram-generatorpackage on Fedora orsystemd-zram-setupon Ubuntu, the bar will be non-zero. - Second CPU graph. Pick temperature, power draw, or frequency and Mission Center draws a second line beneath the existing per-core utilisation. Hold
Ctrlto pause updates — useful for screenshots and bug reports.
A handful of smaller things round it out: a first-run prompt that walks new users through the GPU sensor permission, an eject button for removable storage, and a long list of translation updates.
Installation: pick your package manager
The three realistic installation paths in 2026 are Flatpak, Snap, and AppImage. Distro packages exist but lag — Ubuntu 26.04 ships 1.1.x in the universe repo, and even Arch’s extra was a few days behind the GitLab tag at the time of writing. If you want 1.2.0 today, Flatpak is the path of least resistance.
Flatpak (recommended)
If you have not enabled Flathub yet:
flatpak remote-add --if-not-exists flathub https://flathub.org/repo/flathub.flatpakrepoThen install Mission Center:
flatpak install flathub io.missioncenter.MissionCenterLaunch it from your application menu, or from the command line:
flatpak run io.missioncenter.MissionCenterOn the first run, Flatpak will prompt for permission to read the host’s /sys and /proc so Mission Center can see real hardware data. Grant it; without that, the GPU and SMART panels will be empty.
Snap
If you prefer Snap on Ubuntu:
sudo snap install mission-centerSnap builds track upstream within a few days. The confinement is a little tighter than Flatpak, so GPU monitoring on NVIDIA can be hit-or-miss; on AMD and Intel it works.
AppImage
For a portable, no-install option, download the AppImage from the GitLab releases page:
wget https://gitlab.com/mission-center-devs/mission-center/-/releases
# Pick the latest "MissionCenter-x86_64.AppImage" from the assets list
chmod +x MissionCenter-*.AppImage
./MissionCenter-*.AppImage
The AppImage is self-contained but inherits the host’s /sys permissions, so it tends to see more sensor data than Flatpak on systems where you have not bothered to grant the portal permission.
The CPU page, explained
Open Mission Center and the first thing you see is the Performance view, defaulted to CPU. The grid is per logical thread, with a utilisation bar that fills green→yellow→red as load climbs. Below the grid sits the headline number: average frequency, package temperature, package power, and process count.
1.2.0 added the second graph at the bottom. Click the dropdown above it and pick one of three series:
- Utilisation (the default — same as the per-core grid, but as a time series)
- Temperature in °C, read from
coretempork10tempdepending on your CPU vendor - Power draw in watts, read from Intel RAPL or AMD
amd_energy, where the driver exposes it - Frequency in GHz, sampled every second
On a modern Intel Core Ultra 9 285, you will see all three series populated. On older AMD systems without amd_energy, power draw will be missing — that is a kernel / driver gap, not a Mission Center bug. On Raspberry Pi 5, the temperature series tracks the SoC sensor but the power-draw series is absent; ditto, kernel gap.
Hold Ctrl to pause the UI from refreshing. This stops the graphs from animating so you can copy exact values into a bug report, or just read a number that was flicking between 87% and 91%.
Memory, disk, network
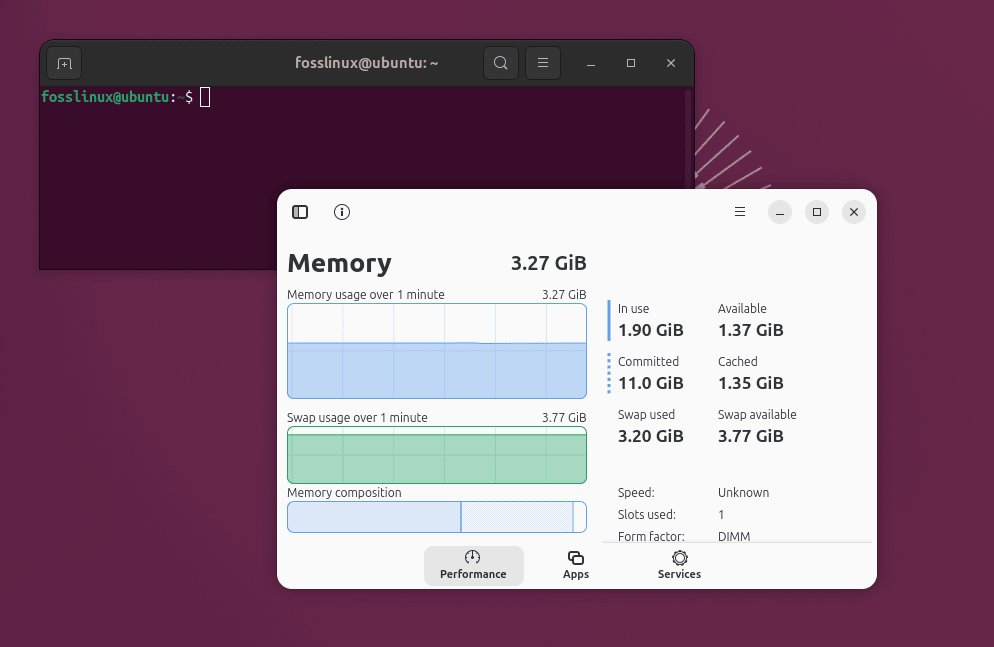
The Memory tab is two bars: physical RAM and swap. Each bar splits into used (filled) and available (empty), with a numeric label overlay that updates every second. In 1.2.0, if you have zRAM configured, a third bar appears below the swap bar showing compressed memory usage. On a default Ubuntu 26.04 install with systemd-zram-setup enabled, the zRAM bar will be roughly half the size of the physical-RAM bar at idle, and will grow under memory pressure.
The Disk page now lists every mounted partition with used / free space and a clickable SMART status indicator. Click the indicator to expand a panel showing reallocated sectors, temperature, and power-on hours for the underlying drive. This is the same data smartctl -A would show, rendered.
The Network tab tracks one wired and one wireless interface at a time. The graph shows aggregate throughput (up + down combined) in megabits per second. If you need per-direction data or per-process network attribution, you are back to nethogs or iftop in a terminal.
GPU monitoring (NVTOP integration)
Mission Center’s GPU page reads from the NVTOP library, which means it sees whatever the kernel exposes through the amdgpu, i915, nvidia, or nvml driver. On a stock Fedora 43 install with an AMD RX 7900 XT, you get utilisation, VRAM usage, temperature, and power draw. On a laptop with Intel integrated graphics, you get utilisation and temperature but no power draw (Intel iGPUs do not expose that). On NVIDIA, the data is excellent provided the proprietary driver is loaded — nvidia-smi and Mission Center should agree to within a few percent.
The catch is GPU process attribution. The GPU page shows aggregate utilisation per GPU, but if you want “which process is hammering the GPU right now” you want the Apps page.
Per-application resource breakdown
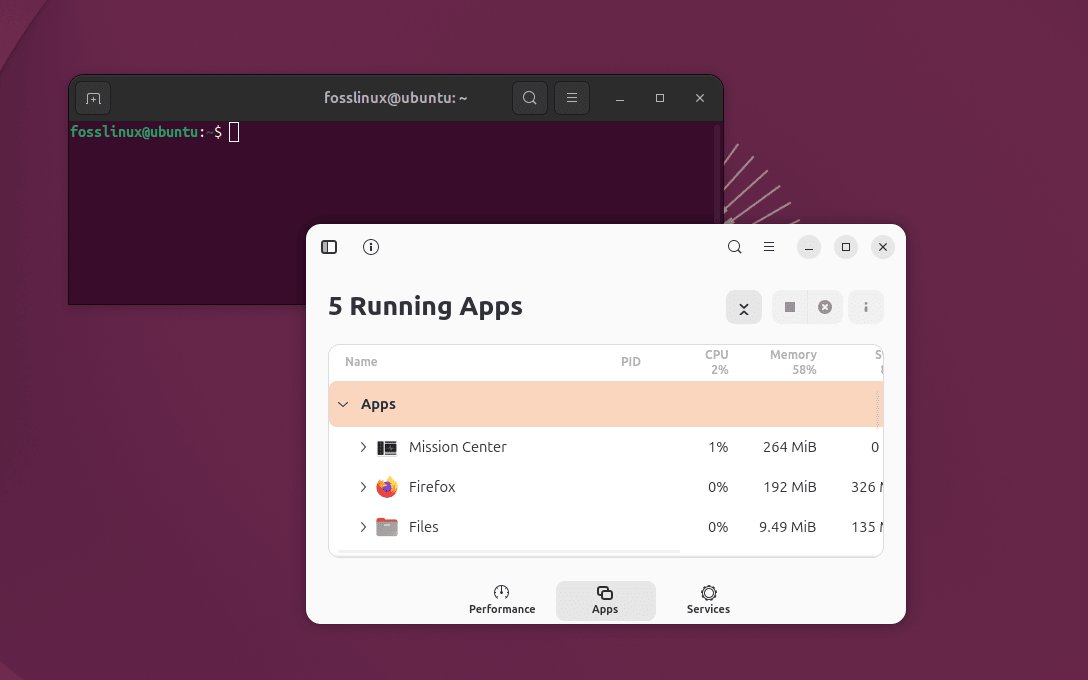
The Apps page is the killer feature for me. It is a flat list of every running process, sortable by CPU, memory, GPU, or disk, with a sparkline next to each row showing the last 60 seconds of activity. Click a row to expand it and you see the child processes, the full command line, and the container / Flatpak ID if applicable.
This is the answer to “Firefox is using 8 GB of RAM and I want to know which tab is to blame” that top and ps make painful. The Sparkline auto-sorts to the top, you click it, you see the tab IDs in the command-line column, you close the tab. Same workflow as Activity Monitor on macOS, but on Linux.
Mission Center vs htop vs btop vs GNOME System Monitor
Here is how Mission Center compares to the other three monitors most Linux users have installed:
- htop. Text-mode, runs over SSH, virtually no overhead. Mission Center is the GUI complement, not the replacement. I still use htop for SSH and quick checks.
- btop. Terminal-based but supports mouse and themes. Good middle ground if you want graphs in a terminal. Mission Center is what you reach for when you want a window with a close button.
- GNOME System Monitor. Ships with GNOME, does the basics (CPU, memory, disk, network, process list). No per-thread CPU view, no GPU, no SMART, no per-app sparklines. If all you need is “is the CPU busy right now”, GNOME System Monitor is already on your system and that is fine.
Mission Center is the option for users who want visual graphs, GPU monitoring, SMART data, and per-app attribution in a single window. The 1.2.0 release with battery telemetry and the second CPU graph makes it a genuinely useful daily tool, not just a pretty wrapper around /proc.
Caveats worth knowing
Three things to keep in mind before you install:
- No remote support. Mission Center is a local desktop app. It needs a display server (X11 or Wayland) and cannot be run over SSH in text mode. For remote server monitoring, stick to htop, btop, or Glances.
- Intel iGPU power draw is missing. Kernel / driver gap, not a Mission Center bug. If you specifically need package power on a Tiger Lake or older Intel chip, Mission Center cannot help you until the kernel exposes the sensor.
- Flatpak portal permission is required for full data. If the GPU and SMART panels are empty after install, open the system Flatpak permission dialog and grant Mission Center access to
/sysand/proc. There is also a first-run in-app prompt that walks you through it.
Verdict
Mission Center 1.2.0 is the best GUI system monitor on Linux in 2026. It is fast (under 0.5% CPU and ~40 MB RAM at idle on my test system), it is built on modern GNOME tooling (GTK4 + Libadwaita, so it looks at home on any GTK desktop), and the 1.2.0 additions — battery telemetry, zRAM stats, per-partition disk, the second CPU graph — close most of the gaps I had with the 1.x line. If you are still juggling three different tools to see CPU, GPU, and disk data at the same time, install it through Flatpak and give it a week. The graphs and per-app sparkline will change how you look at system performance.
Official project page: missioncenter.io. Source and releases: gitlab.com/mission-center-devs/mission-center.
Comments