
What PSI actually measures
Pressure Stall Information (PSI) was merged in Linux 4.20 (commit e970d0aa0bb98a9d4b9a2e3887da44b79f7b46c8 upstream — Johannes Weiner’s psi-tracking series). It is not a load average, it is not a throughput number, and it is emphatically not a “how busy is the CPU” metric. PSI answers one question and one question only:
For how much wall-clock time did at least one task in this scope (system or cgroup) stall waiting on the resource?
The unit is ms during the measurement window — the more stalls, the higher the number. Linux exposes three PSI resources: cpu, some/io, some/memory, full/ (only available in cgroup v2). This article is about some/memory and full/ — the memory-pressure pair.
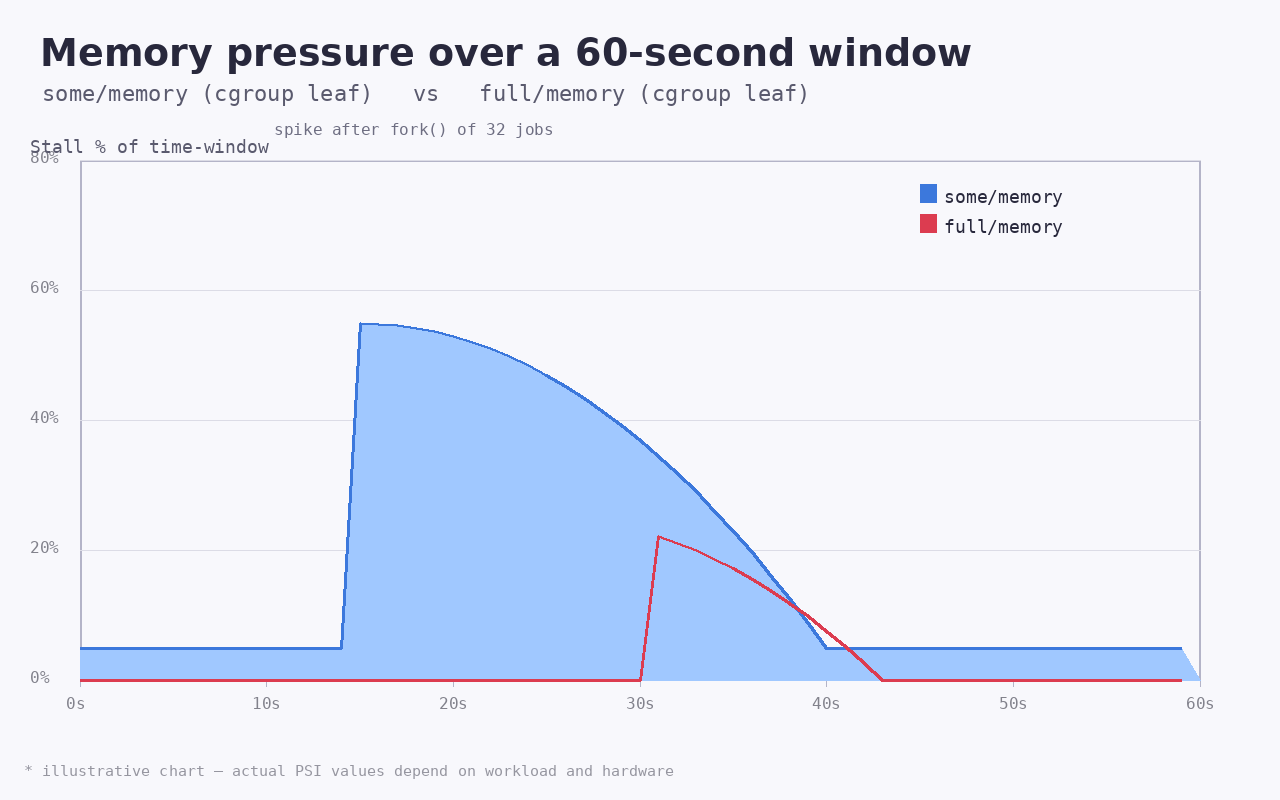
somedata/memory (/proc/pressure/memory) aggregates all tasks stalled for any memory cause. The “some” prefix means “some task in the set had to wait.” full/memory (cgroup v2 only) means “everyone in the set was stalled at the same instant.” If your workload has 32 workers and 31 are running while 1 is blocked reclaiming, some lights up; full stays at 0. When all 32 are stuck simultaneously, both light up.
A timeline view helps
Imagine a 1-second window. The kernel sums up, for each 100ms slice, how many tasks were task-runnable-blocked waiting on memory. The exposure is then reported as:
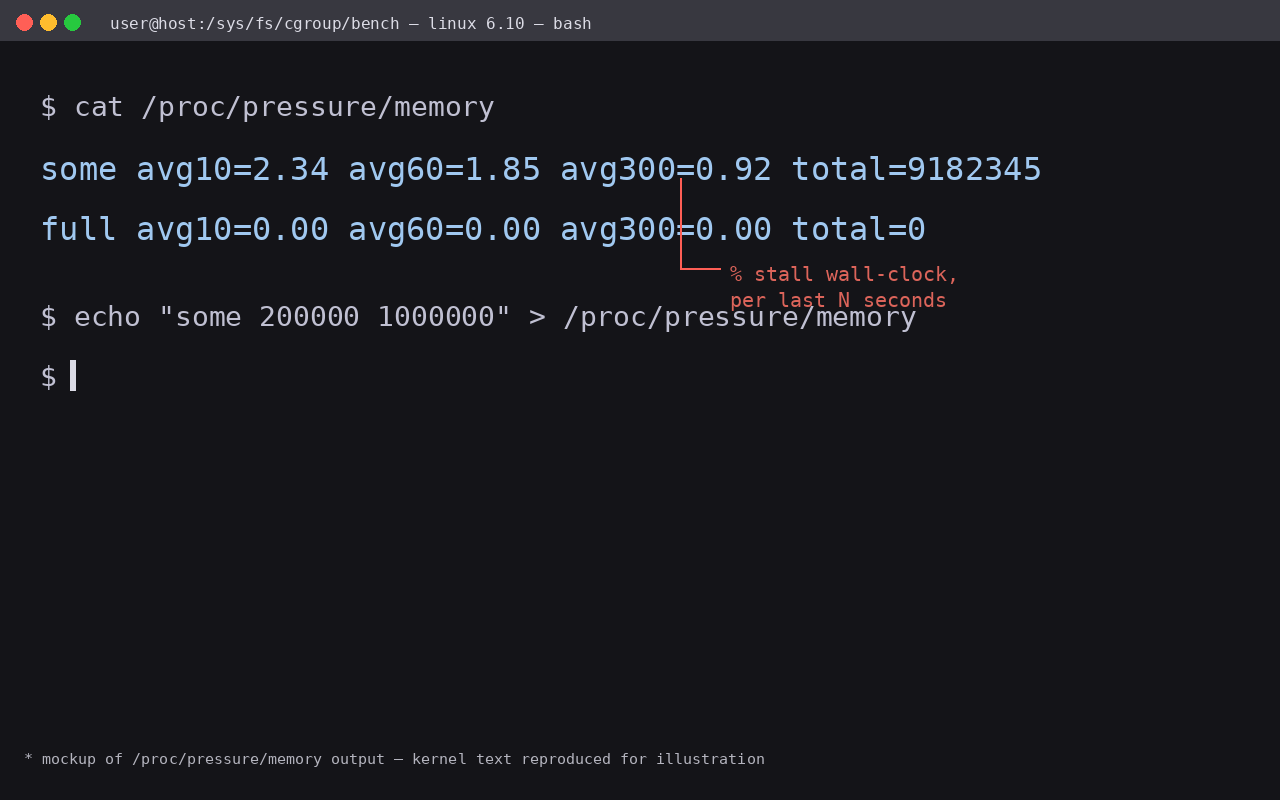
some avg10=2.34 avg60=1.85 avg300=0.92 total=9182345
full avg10=0.00 avg60=0.00 avg300=0.00 total=0
The avg10/60/300 are exponential moving averages with α = 2/(window+1), so avg10 reacts fast to spikes. The total is cumulative microseconds, since boot, that at least one task was stalled. This is the canonical format and the only thing tooling should consume.
Where the kernel computes it
All PSI accounting happens inside kernel/sched/psi.c. The mechanism is the per-cgroup PSI groupcpu + groupmemory state machine. Each cgroup gets two state arrays, one for pressure-tracking-on-this-cpu, one for per-cgroup recursion. On every context switch, scheduler tick, and memory reclaim callback, the kernel calls psi_task_change() (or its psi_memstall_{enter,leave} wrappers when the cause is memory-specific).
The relevant call sites in mm/ are:
| Caller | Why | PSI update |
|---|---|---|
shrink_inactive_list() (mm/vmscan.c) |
direct reclaim: pages pulled from inactive LRU | memory.ENTER on entry, memory.LEAVE after |
balance_pgdat() |
kswapd waking up to scan a node | enters when nr_writeback + nr_inqueue > watermark |
page_alloc() slowpath |
GFP_KSWAPD_RECLAIM / GFP_DIRECT_RECLAIM triggers | psi_memstall_enter |
try_to_free_pages() |
thin allocation fail path | enters |
compaction_alloc() |
compaction-induced stalls | enters on contention |
cgroup memory.pressure writes |
signal userspace on threshold trip | write-side callback in cgroup-v1/pressure.c |
The elegant property: the stall signal is recorded even if the reclaim actually succeeds 5 microseconds later. PSI does not measure whether the system lost work; it measures whether any task was made to wait. That distinction matters when sizing work — even a one-page stall on a 256KB request means somebody was blocked.
Polling vs trigger mode
PSI gives you two interfaces:
Polling — read once, keep your own state
cat /proc/pressure/memory
# some avg10=0.05 avg60=0.01 avg300=0.00 total=12345
# full avg10=0.00 avg60=0.00 avg300=0.00 total=0
/proc/pressure/memory is the system-wide resource. The full/ line is not present here — full requires a cgroup context, because “100% of one task” is trivially true at the system level and would be noise.
Trigger — push the kernel to wake you only when it matters
cat > /proc/pressure/memory <<EOF
some 200000 1000000  # 200ms in any 1s window
EOF
This installs a trigger on the some line. The kernel arms a pollqueue; when the some line ever exceeds 200ms stall in a 1s window, it pollwake()s your fd, your poll()/select() returns POLLPRI, and you read-and-reset the pressure state. You must keep reading — a missed wakeup leaves the trigger armed but unstamped.
The double threshold syntax (stall_us window_us) is a debouncing mechanism. PSI triggers fire only when the cumulative stall exceeds stall_us and that exposure persists for the entire window_us duration. A 50ms blip with 1ms gaps between won’t wake you; sustained 20% memory-pressure for half a second will.
Production gotcha: installing a trigger on a cgroup v2 leaf requires write permission to cgroup.event_control (legacy v1) or memory.pressure (v2). Unprivileged users can’t arm the trigger even though they can read the metric freely.
Polling vs trigger — when each wins
| Use case | Pattern |
|---|---|
| Horizontal autoscaler deciding to launch another pod | Trigger. Don’t poll every second if 99 seconds are uneventful. |
| Long-term capacity dashboard / Grafana scrape | Polling. Walking averages 5s–60s smooths jitter. |
| Live debugging a slow request | watch -n 1 cat for 30s. You don’t want to install triggers and forget them. |
Kubernetes memory-pressure eviction (kubelet --eviction-pressure-transition-period) |
Trigger, on memory.available indirectly. |
Wiring PSI into cgroup v2
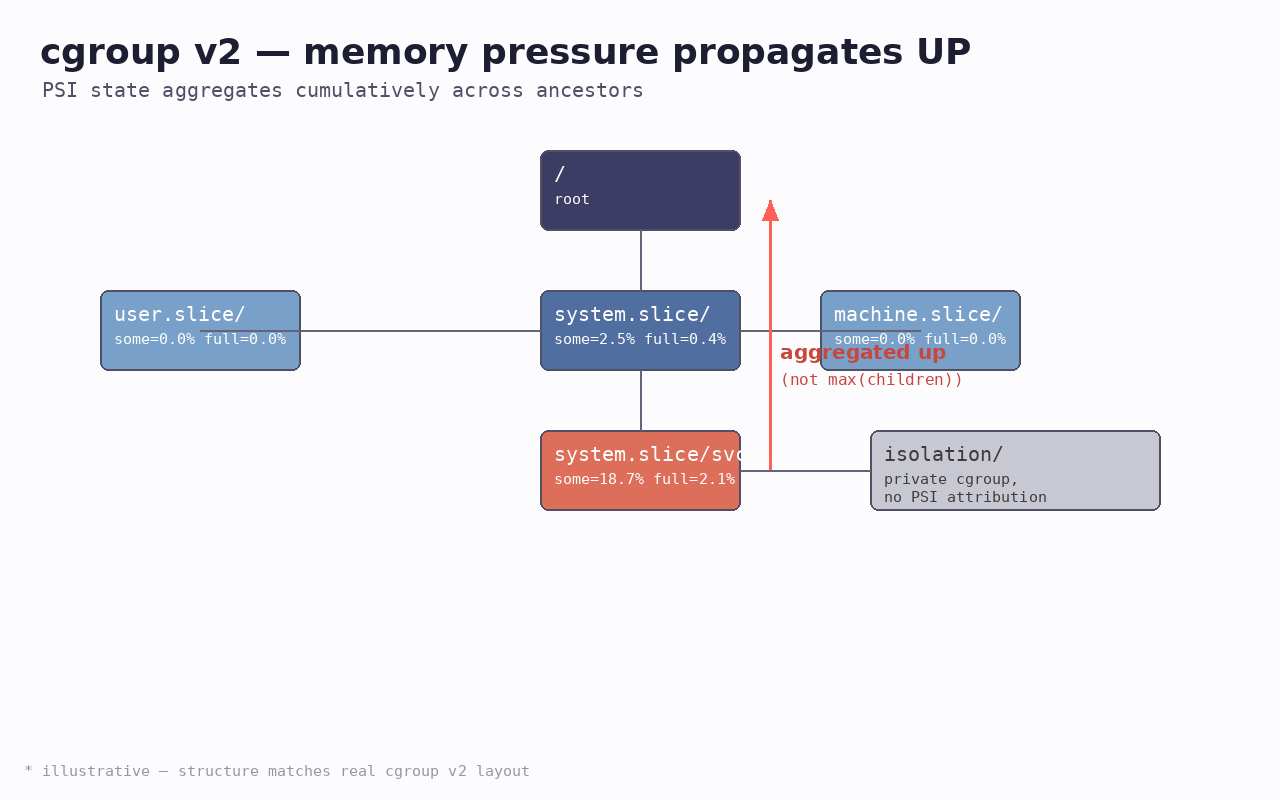
Memory pressure propagates up the cgroup tree. If cgroup B/A/my-pod is under memory pressure, the kernel also credits pressure time to every ancestor that has PSI enabled (the default in v2). The file memory.pressure lives in every non-leaf cgroup that opts in via cgroup.subtree_control +memory.
Read a leaf’s full pressure:
mkdir -p /sys/fs/cgroup/bench
# already a leaf by default
cd /sys/fs/cgroup/bench
cat memory.pressure
# some avg10=12.34 avg60=8.10 avg300=4.55 total=9182345
# full avg10=2.10 avg60=1.04 avg300=0.50 total=4451234
This is what the kernel exports to Kubernetes via the kubelet, and what container runtimes surface to OOM-free observability stacks.
The ancestor aggregation contract
Be precise about what "full" means at the root. A pressure event in a leaf is added to every ancestor that has it enabled. The sums are not “max of children” — they are unions with overlap. So if two siblings are simultaneously stalled, the parent’s full line lights up exactly once, not twice.
This matters for capacity planning. Don’t double-count.
Reading memory.pressure from a container runtime
Practical pipeline: cgroup v2 enabled + CONFIG_PSI=y (default on most distros since 5.x).
Verify your kernel has it:
zgrep PSI /proc/config.gz
# CONFIG_PSI=y
Read it from inside a running container — you only need to mount the cgroup v2 hierarchy:
# inside a privileged debugging container
cat $(mount -t cgroup2 | awk '{print $3}')/memory.pressure
Or, in Go:
// gopsutil: memtype.VirtualMemory() does NOT give PSI.
// Use this instead:
import "github.com/prometheus/procfs"

psi, err := procfs.NewPSI("/proc/pressure/memory")
if err != nil { return err }
some, _ := psi.SomePSI()
fmt.Println(some.Avg10, some.Avg60)
Or in Python, parse the format directly:
def read_psi(path):
    out = {}
    with open(path) as f:
        for line in f:
            label, rest = line.split(" ", 1)
            fields = dict(t.split("=") for t in rest.split())
            out[label] = {k: float(v) for k, v in fields.items()}
    return out
For cgroup v2 inside a container with namespace awareness, just read memory.pressure at the in-container mount point (/sys/fs/cgroup/...).
What PSI catches that loadavg doesn’t
top shows wa (iowait %). /proc/loadavg shows load average. Both are popularity contests: they tell you the system is busy, but not whether anything is making forward progress on the work that matters.
PSI is the first metric the Linux kernel exports that’s work-bound. A 10% some/memory for 60 seconds means “for 6 of those 60 seconds, at least one task was asleep waiting on memory.” That tells you:
- the system has enough spare capacity to run scans in background without blocking
- (or) the workload’s per-page working set just exceeded RAM and is now paging — which loadavg can’t tell you
The classic case: a kernel build with make -j$(nproc) doesn’t go faster when you add cores — it goes faster when there are zero reclaimed-page stalls. PSI tracks the latter directly; loadavg doesn’t.
Common production patterns
Pattern 1 — Automated scale-out on PSI
A scraper that consumes RSS work units:
import time, subprocess
def pressure_pct():
    out = subprocess.check_output(
        ["/bin/cat", "/sys/fs/cgroup/bench/memory.pressure"]
    ).decode()
    for line in out.splitlines():
        if line.startswith("some"):
            return float(line.split()[1].split("=")[1])
    return 0.0

while True:
    p = pressure_pct()
    if p > 30.0:           # 30% of last 10s was memory-stalled
        log("scale-out: spawning extra worker")
        spawn_extra_worker()
    time.sleep(10)
Pattern 2 — Trigger-based eviction hint
# 500ms of memory stall in any 5s window → evict
echo "some 500000 5000000" > /sys/fs/cgroup/canary/memory.pressure
# kernel will pollwake us when the threshold trips
This is essentially what Kubernetes’ --eviction-pressure-transition-period mechanism does, but you can run it yourself for non-K8s workloads.
Pattern 3 — Tail-latency debugging
When p99 spikes, sample /proc/pressure/memory over the spike window. If some avg10 > 1.0 (100ms+ of wait per 10s), memory pressure is on the suspect list. Pair it with cat /proc/vmstat | grep -E 'pgfault|pgmajfault' to distinguish minor faults (file cache misses, normal) from major faults (real disk reads, expensive).
The full/ vs some/ decision — full is harder
full reporting only fires when all runnable tasks in the set are stalled. This is rare at the system level — you almost always have at least one kernel thread running. It’s meaningful at the cgroup level, where the entire workload might be your four-pod Redis-tier replicas, all of which become memory-blocked during a slowness event.
If you’re operating a homogeneous fleet (e.g. all replicas are stateful workers running the same binary), full/memory is a leading indicator that everyone is suffering together — distinct from “one of my pods is misbehaving and stalling.”
Practical advice: alert on some avg60 > 5.0 for a first-warning page, and on full avg10 > 0.5 for a “we’re past no-return” page.
How it interacts with memory cgroup limits
some/memory fires whether the cause is global reclaim, NUMA-locality migration, or cgroup-imposed hard memory limits. To disambiguate:
# Read memory.current — this cgroup's actual usage
cat /sys/fs/cgroup/bench/memory.current
# Read memory.high — soft limit (reclaim pressure target)
cat /sys/fs/cgroup/bench/memory.high
# Read memory.max — hard limit (kill target)
cat /sys/fs/cgroup/bench/memory.max
If memory.current > memory.high and PSI is high, the cgroup is in soft-limit reclaim — kernel is asking the workload to free memory but not killing it yet. If memory.current >= memory.max and PSI keeps climbing, you’re about to hit the OOM-kill path. Watch memory.events for low/high/max/oom counters — they’re the outcome of the stalls that PSI is reporting in real time.
Detailed on the cgroup v2 memory model in the companion article: Memory cgroup v2: how the kernel enforces the budget.
Limitations and sharp edges
- No kernel-before-4.20 support. If you’re on RHEL 7 (3.10), backport from CentOS Stream isn’t always clean. Use vmstat + custom instrumentation.
- Trigger windows are not free. A trigger installed but never read back leaves the kernel polling for each cgroup write. Don’t install dozens.
- Triggers fire on
POLLPRI, notPOLLIN.select()andepoll_wait()users often forget this. Old Node.js bindings default toPOLLIN; you needeventType: 'PRI'. totalis monotonic; it overflows on 32-bit builds (~71 minutes). Always readavg*for decisions; treattotalas a “yes/no, has PSI ever fired” check.- Work-conserving scheduling can mask stalls. If your workload has 100 busy threads on a 32-core box, stalls within those 100 are visible but the kernel keeps CPUs full, so
toplooks busy. PSI is your only signal that progress is slow per task. - Container memory.pressure requires
cgroup2mount. If you’re oncgroup v1(legacy systemd), PSI is system-wide only —memory.pressureper-cgroup is v2-only.
Where to read the code
If you’re hunting bugs or just want the ground truth:
kernel/sched/psi.c— the whole accounting state machineinclude/linux/psi.h—psi_memstall_{enter,leave}macros used by reclaim pathsmm/vmscan.c— mostENTER/LEAVEcalls live heremm/page_alloc.c— slowpath’s__GFP_*handlingkernel/cgroup/memcg-v1.candmemcontrol.c— per-cgroup aggregationDocumentation/admin-guide/psi.rst— the official doc, sparse but accurateDocumentation/accounting/psi.rst— older format, still useful
That’s the surface. It looks small but the accounting adds a few percent scheduling overhead on reclaim-heavy workloads, which is why it’s gated by CONFIG_PSI=y and can be turned off at boot with psi=0 (passing as kernel cmdline) for performance-critical paths.
## Related articles
This is one of three on Linux kernel memory management under tux.fan’s os-kernel tag.
– [Linux memory cgroup v2: how the kernel enforces the budget](https://tux.fan/2026/07/21/memory-cgroup-v2/) — companion piece. PSI’s per-cgroup `memory.pressure` only makes sense if you understand the three-tier limit (`low` / `high` / `max`) and the LRU-per-memcg accounting model.
– [Linux multi-generational LRU: state of mglru in 2026](https://tux.fan/2026/07/21/mglru-page-reclaim/) — where PSI gets its eviction callbacks. The article covers the generational algorithm, the active/inactive comparison, and the live 2026 LSFMM+BPF discussion on whether the algorithm survives.
Comments